Certain occasions prompt companies to make a thorough examination of their financial structure: an expansion project, an insufficient cash reserve or an increase in expenses. You can also make such a review if you need to borrow more frequently as your turnover increases or if a customer wants to place a large order with a longer payment term than normally offered.
Taking a close look at your financial ratios is one way to assess your financial health and figure out how it could be improved. These ratios are used to make comparisons between different aspects of a company’s performance, or to determine how the company ranks within an industry or region. They reveal fundamental clues, such as whether you’ve taken on too much debt, accumulated too much inventory, or aren’t collecting your accounts receivable fast enough.
A common use of financial ratios is for a lender to assess the stability and health of your business by examining its balance sheet . The balance sheet gives a picture of what your business owns or what it owes (assets) and what it owes (liabilities). Bankers often incorporate financial ratios into a commercial loan agreement . For example, you may be required to maintain your equity above a certain percentage of your debt, or your current assets above a certain percentage of your current liabilities.
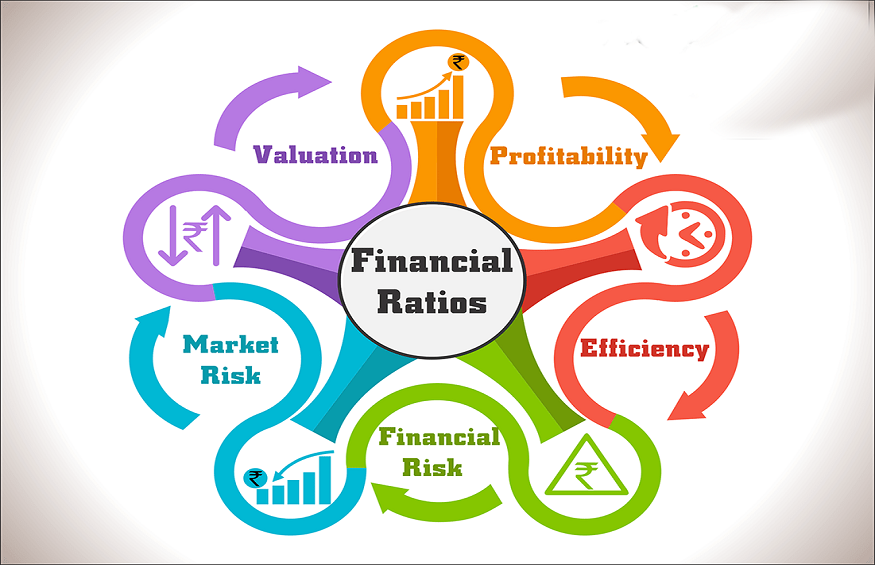
However, the ratios should not be evaluated only at the time of a visit to your banker. Ideally, you should review your ratios monthly to keep track of changing trends within your business. Although different terms are used for different ratios, they fall into 4 main categories.
Liquidity ratios
They measure the amount of liquidity (cash and easily convertible assets) you have to meet your commitments, and give an overview of your financial health.
The general liquidity ratio measures your company’s ability to produce cash to meet its short-term financial commitments. Also called the working capital ratio, it is calculated by dividing your current assets (such as cash, inventory and accounts receivable) by your current liabilities, such as your line of credit balance, suppliers and the portion of long-term debt maturing within one year.
The relative liquidity ratio measures your ability to quickly access cash to meet immediate needs. Also called the reduced cash ratio , it is calculated by dividing current assets (excluding inventory) by current liabilities (excluding the portion of long-term debt due within one year). A ratio greater than or equal to 1.0 is generally acceptable, but this may vary depending on the sector in which your business operates.
A relatively low ratio may mean that your business is struggling to meet its commitments and may not be able to take advantage of opportunities that require quick access to cash. Debt settlement can improve this ratio; you may find it desirable to postpone certain purchases or consider long-term borrowing to pay off short-term debt. You could also review your credit policies towards customers and adjust them as needed to reduce the collection time for accounts receivable.
A higher ratio may mean that your capital is underutilized, which could encourage you to invest more of your capital in projects that will promote growth, for example innovation, product or service development, R&D or international marketing.
However, what constitutes an adequate ratio varies from industry to industry. For example, a clothing store will hold products that quickly lose value due to changing fashion trends. On the other hand, these properties are easy to liquidate and have a high turnover rate. As a result, small amounts of money are constantly flowing in and out, and in the worst-case scenario, liquidation is relatively easy. A company like this could easily operate with a general liquidity ratio of close to 1.0.
On the other hand, an aircraft manufacturer has high-value non-perishable assets like in-process production, as well as longer payback times. Businesses like this need to carefully plan payment terms with their customers; the general liquidity ratio should be much higher in order to cover its short-term liabilities.
Efficiency ratios
Often calculated for a period of 3 to 5 years, these ratios provide additional information on certain aspects of your activities, such as collection of accounts receivable, cash flow and operating results.
Inventory turnover indicates the time it takes for inventory to be sold and replaced during the year. This ratio is calculated by dividing total purchases by average inventory during a given period. For most businesses that rely on inventory, this can be a key success factor. After all, the longer inventory is held, the more expensive it is.
The inventory to net working capital ratio can indicate if too much of your working capital is allocated to inventory. This ratio is calculated by dividing inventory by total current assets. In general, it is preferable that this ratio be as low as possible. Improving this ratio will allow you to invest more of your working capital in growth-oriented projects, such as export development, R&D and marketing.
Assessing inventory ratios depends a lot on the industry you operate in and the quality of your inventory. Ask yourself the following question: are the goods I sell seasonal (like ski equipment), perishable (food) or can they easily become obsolete (fashion)? Depending on the answers, these ratios will vary significantly. Nevertheless, regardless of the industry in which you operate, inventory ratios can help you improve the efficiency of your business.
Profitability ratios
These ratios are not only used to assess the financial viability of your business, but they are essential for comparing your business to others operating in the same industry. You can also identify trends within your business by comparing these ratios over a number of years.
Net profit margin measures how much a business earns (usually after tax) relative to its sales. A company that has a higher net profit margin than its competitors is generally more efficient, flexible and able to seize new opportunities as they arise.


